Best Business Intelligence Dashboards for Enterprise Reporting and Data Visualization
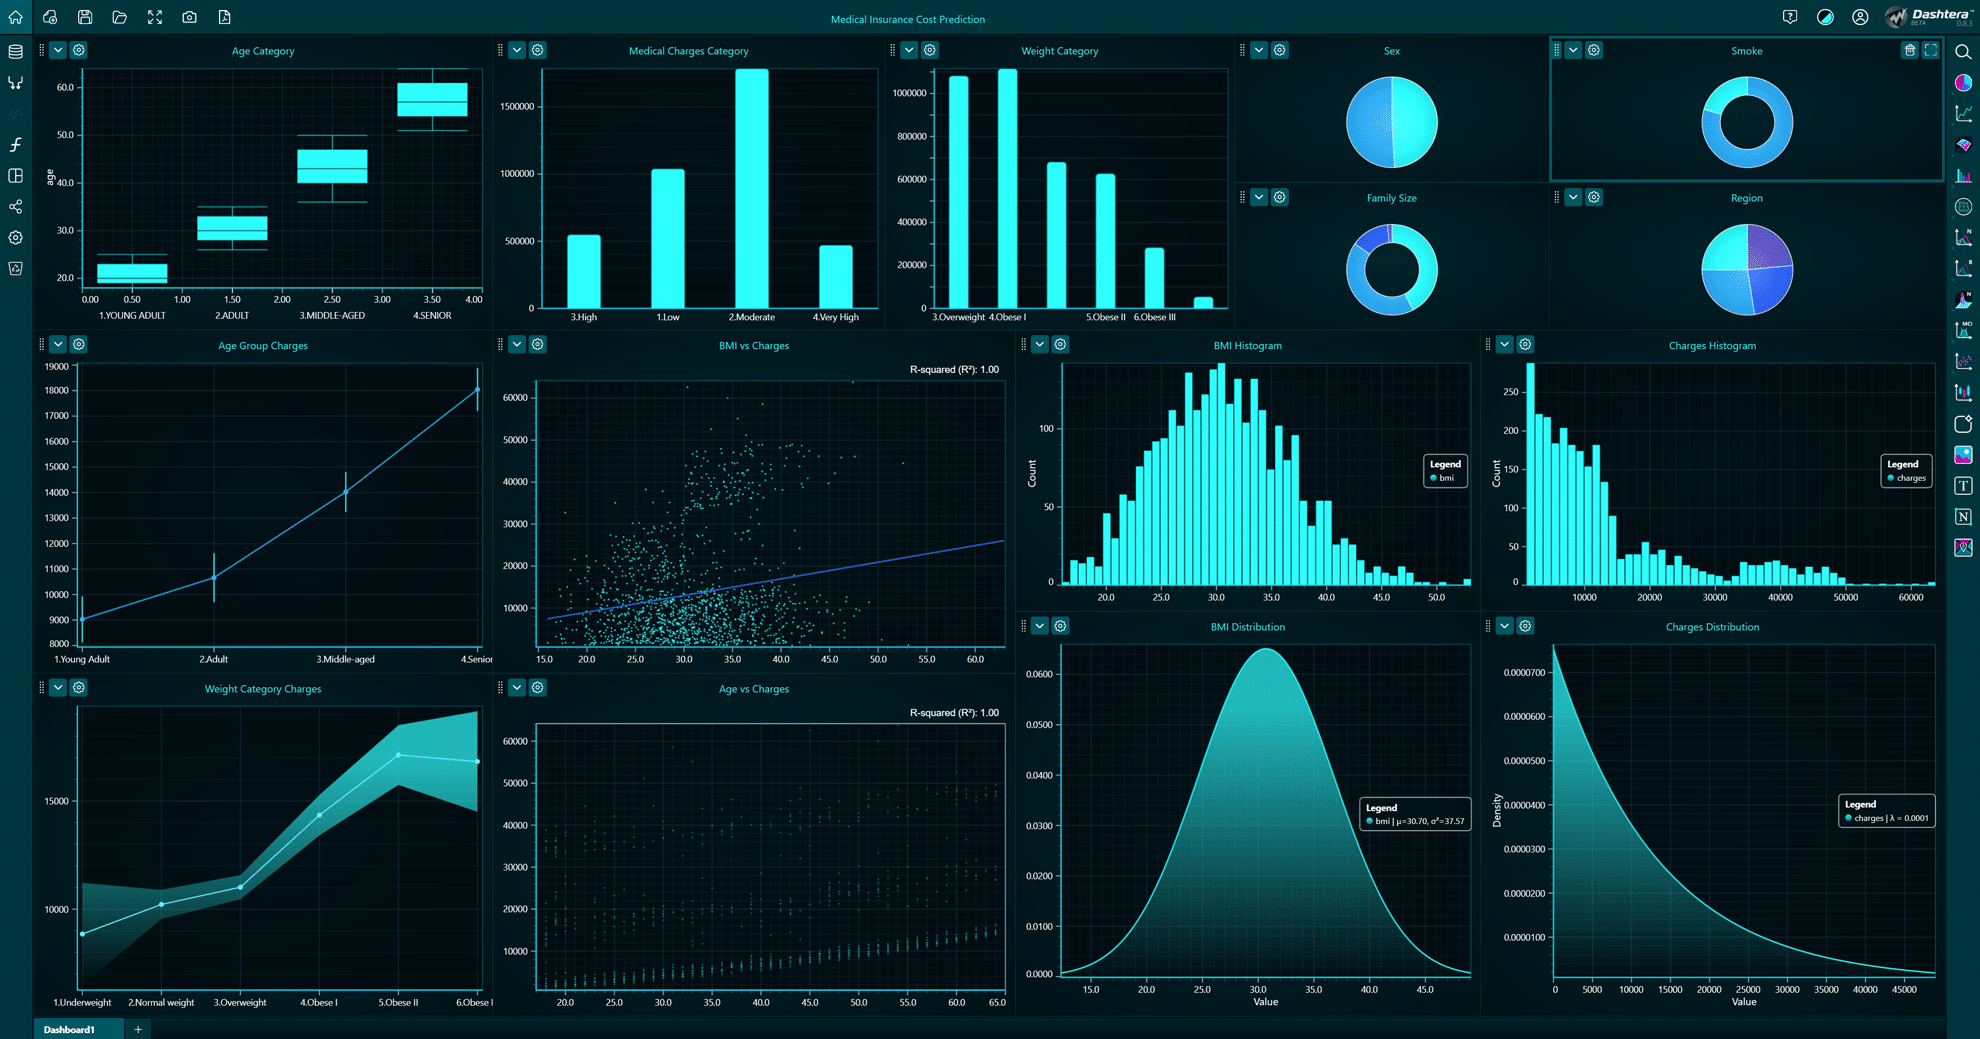
Best Business Intelligence Dashboards for Enterprise
Reporting and Data Visualization
Introduction
Modern enterprises generate enormous
amounts of data from sales systems, financial applications, customer
relationship management platforms, marketing tools, and operational databases.
However, having access to large amounts of information does not automatically
lead to better business decisions.
Companies need effective ways to
organize, visualize, and understand their data. This is why Business
Intelligence (BI) dashboards have become essential tools for organizations that
want to improve reporting and monitor business performance.
A well-designed BI dashboard
transforms complicated datasets into visual reports, charts, graphs, and key
performance indicators (KPIs). Instead of reviewing multiple spreadsheets,
managers can access important business information through a centralized
interface.
For large organizations, enterprise
BI dashboards also support collaboration between departments, standardized
reporting, and more consistent decision-making.
In this guide, we explore the best
business intelligence dashboards for enterprise reporting and data
visualization in 2026. We compare popular platforms, explain their main
features, and discuss how companies can select the right solution for their
analytical requirements.
What
Is a Business Intelligence Dashboard?
A Business Intelligence dashboard is
a visual interface that presents important business information in an organized
and easy-to-understand format.
It collects data from different
sources and displays relevant metrics through charts, tables, graphs, and
interactive visualizations.
For example, a retail company may
use a BI dashboard to monitor:
- Total sales revenue.
- Monthly profit margins.
- Customer acquisition costs.
- Inventory levels.
- Marketing campaign performance.
- Regional sales results.
- Customer retention rates.
Instead of preparing individual
reports for every department, companies can use dashboards to provide a shared
view of business performance.
Main
Types of BI Dashboards
1. Strategic Dashboards
Strategic dashboards provide
executives with a high-level view of long-term business performance.
They typically include revenue
growth, profitability, market performance, and strategic KPIs.
2. Operational Dashboards
Operational dashboards monitor daily
business activities.
For example, a logistics company may
use them to track delivery times, warehouse performance, and order processing.
3. Analytical Dashboards
Analytical dashboards help users
investigate historical data, identify patterns, and compare different business
metrics.
They often include interactive
filters and advanced visualization features.
4. Financial Dashboards
Financial dashboards help finance
teams monitor revenue, expenses, cash flow, budgets, and profitability.
These dashboards can support
financial planning and performance analysis.
Best
Business Intelligence Dashboards for Enterprise Reporting in 2026
The best platform depends on data
infrastructure, company size, reporting requirements, security needs, and
employee experience.
Here are eight BI platforms worth
considering.
1.
Microsoft Power BI
<text color="secondary"
size="xs">Best for: Enterprise reporting and Microsoft ecosystem
integration</text>
Microsoft Power BI is one of the
most widely used business intelligence platforms. It helps organizations
connect data sources, create interactive dashboards, and distribute reports
across departments.
Its integration with Microsoft
Excel, Microsoft 365, Azure, and other business applications makes it
attractive to companies already using Microsoft's technology ecosystem.
Key Features:
- Interactive dashboards.
- Custom data visualizations.
- Data modeling.
- KPI monitoring.
- Natural language data exploration.
- Automated report distribution.
- Integration with Microsoft Fabric.
Advantages:
Power BI provides a flexible
reporting environment for organizations of different sizes. Employees can
explore business metrics through dashboards, while administrators can manage
access and reporting governance.
Its connection to Microsoft's wider
ecosystem can also simplify data workflows.
Limitations:
Enterprise deployments may require
careful licensing, data governance, and workspace management. Advanced data
modeling and administration can also require technical expertise.
2.
Tableau
<text color="secondary"
size="xs">Best for: Advanced data visualization and interactive
reporting</text>
Tableau is a popular analytics
platform known for its data visualization capabilities.
It allows organizations to transform
complex datasets into interactive dashboards that help employees explore
business performance.
Tableau is particularly useful when
companies need to communicate analytical findings clearly to executives,
managers, and operational teams.
Key Features:
- Interactive visualizations.
- Custom dashboards.
- Data exploration.
- Tableau Pulse.
- AI-assisted analytical capabilities.
- Data source connections.
- Enterprise reporting.
Advantages:
Tableau provides extensive
visualization options and supports interactive data exploration. It can help
organizations communicate trends and relationships that may be difficult to
understand in traditional spreadsheets.
Limitations:
Businesses should evaluate licensing
costs, data preparation requirements, and the technical resources needed to
manage larger deployments.
3.
Google Looker
<text color="secondary"
size="xs">Best for: Governed enterprise metrics and cloud-based
BI</text>
Google Looker is a business
intelligence platform designed to help organizations explore and visualize
information through centralized data models.
Its LookML modeling language allows
businesses to define consistent metrics and business logic across departments.
This is particularly important for
enterprises where different teams may otherwise calculate revenue, customer
activity, or operational performance differently.
Key Features:
- Centralized data modeling.
- Interactive dashboards.
- Data exploration.
- Governed business metrics.
- Cloud data integration.
- Conversational analytics capabilities.
Advantages:
Looker can help organizations
establish consistent reporting standards. Its cloud-oriented architecture is
useful for businesses that already rely on Google Cloud and modern data warehouses.
Limitations:
Building and maintaining data models
may require technical expertise. Organizations should also evaluate their
existing cloud infrastructure before implementation.
4.
Qlik Cloud Analytics
<text color="secondary"
size="xs">Best for: Interactive data discovery and analytical
dashboards</text>
Qlik Cloud Analytics provides
business intelligence, data visualization, and data exploration capabilities.
Its associative analytics approach
allows users to explore relationships across datasets instead of following only
predefined reporting paths.
This can help enterprise teams
investigate unexpected performance changes and discover patterns across
departments.
Key Features:
- Interactive dashboards.
- Associative analytics.
- Data integration.
- AI-assisted insights.
- Natural language interaction.
- Data exploration.
- Automated analytics capabilities.
Advantages:
Qlik is useful for companies that
need flexible data exploration. Employees can investigate business information
from multiple perspectives and identify relationships between different
metrics.
Limitations:
Users may need training to
understand its analytical approach. Data preparation and governance also
require attention in large deployments.
5.
SAP Analytics Cloud
<text color="secondary"
size="xs">Best for: Enterprises using SAP business
applications</text>
SAP Analytics Cloud combines
business intelligence, planning, and analytics capabilities in a cloud-based
environment.
It helps organizations create
dashboards, analyze financial and operational performance, and connect
reporting with planning activities.
Its integration with SAP's broader
business software ecosystem makes it relevant for enterprises that already use
SAP applications.
Key Features:
- Business intelligence dashboards.
- Data visualization.
- Financial planning.
- Predictive analytics capabilities.
- Enterprise reporting.
- SAP ecosystem integration.
- Collaborative planning.
Advantages:
SAP Analytics Cloud can help
businesses connect reporting and planning workflows. It is especially useful
for organizations that want to analyze operational information alongside
financial performance.
Limitations:
Companies outside the SAP ecosystem
should carefully evaluate integration requirements. Implementation and
configuration can also be complex for large organizations.
6.
IBM Cognos Analytics
<text color="secondary"
size="xs">Best for: Enterprise reporting and governed business
intelligence</text>
IBM Cognos Analytics is an
enterprise BI platform that supports reporting, dashboards, data exploration,
and analytics.
It is designed for organizations
that need structured reporting environments and centralized access to business
information.
Key Features:
- Enterprise reporting.
- Interactive dashboards.
- Data visualization.
- AI-assisted analytics.
- Report scheduling.
- Data exploration.
- Access and governance controls.
Advantages:
Cognos is suitable for organizations
that require consistent reporting across departments and business units.
Its reporting capabilities can
support complex enterprise environments where information must be distributed
in controlled formats.
Limitations:
Implementation may require technical
resources, especially when connecting multiple enterprise systems and
configuring reporting governance.
7.
Domo
<text color="secondary"
size="xs">Best for: Cloud-based dashboards and connected business
data</text>
Domo is a cloud-based business
intelligence platform that helps companies connect information from different
applications and visualize business performance.
It provides dashboards designed to
make data more accessible to employees across different departments.
Key Features:
- Cloud-based dashboards.
- Data integration.
- Interactive visualizations.
- KPI monitoring.
- Automated alerts.
- Data sharing.
- AI-related analytics capabilities.
Advantages:
Domo can help organizations
centralize information from multiple business systems. Its dashboard approach
makes it easier for different teams to monitor performance and share insights.
Limitations:
Companies should assess pricing,
data integration requirements, and the level of customization needed before
choosing the platform.
8.
Sisense
<text color="secondary"
size="xs">Best for: Embedded analytics and customized
dashboards</text>
Sisense is an analytics platform
that helps organizations build dashboards and integrate analytical capabilities
into business applications.
It can be useful for software
companies that want to provide reporting features directly inside their
products.
Key Features:
- Embedded analytics.
- Interactive dashboards.
- Data visualization.
- Data integration.
- Custom analytics applications.
- AI-assisted analytical capabilities.
- Developer-oriented tools.
Advantages:
Sisense offers flexibility for
organizations that need customized dashboards or want to embed analytics into
customer-facing applications.
Limitations:
Its more advanced capabilities may
require developer involvement and technical planning. Businesses looking only
for simple internal reporting may prefer a less complex solution.
Business
Intelligence Dashboard Comparison
|
Platform |
Best
For |
Main
Strength |
|
Microsoft Power BI |
Enterprise reporting |
Microsoft ecosystem integration |
|
Tableau |
Data visualization |
Interactive visual analytics |
|
Google Looker |
Governed cloud BI |
Centralized metrics |
|
Qlik Cloud Analytics |
Data discovery |
Associative analytics |
|
SAP Analytics Cloud |
SAP enterprises |
BI and planning integration |
|
IBM Cognos Analytics |
Enterprise reporting |
Structured reporting |
|
Domo |
Cloud dashboards |
Connected business data |
|
Sisense |
Embedded analytics |
Custom dashboards |
Each platform serves different
business needs. Power BI and Tableau are strong options for general enterprise
reporting and visualization, while Looker emphasizes governed metrics. SAP
Analytics Cloud and IBM Cognos may be particularly relevant to organizations
with established enterprise reporting environments.
Key
Benefits of Enterprise BI Dashboards
1.
Faster Business Decision-Making
BI dashboards allow managers to
access important business metrics without waiting for manually prepared
reports.
This can make it easier to identify
performance changes and respond to business challenges.
2.
Better Data Visualization
Visual dashboards make complicated
datasets easier to understand.
Charts, graphs, maps, and KPI
indicators can help employees recognize trends and relationships more quickly.
3.
Centralized Business Reporting
Enterprises often store information
across multiple departments and applications.
BI platforms can connect these
sources and provide a more consistent reporting environment.
4.
Improved KPI Monitoring
Companies can define important
performance indicators and monitor progress toward business objectives.
For example, executives can track
revenue growth, operating expenses, customer retention, and productivity
through centralized dashboards.
5.
Better Collaboration Across Departments
Shared dashboards help finance,
marketing, sales, and operations teams work with consistent business
information.
This can reduce reporting
inconsistencies and improve communication.
6.
More Efficient Reporting Processes
Automated data refreshes and
scheduled reports can reduce repetitive reporting tasks.
Finance and analytics teams can
spend more time investigating results instead of preparing spreadsheets.
How
to Choose the Right BI Dashboard Software
Selecting an enterprise BI platform
requires more than comparing visualization features.
Businesses should consider the
following factors.
1. Data Integration
Choose a platform that connects to
existing databases, cloud services, ERP systems, CRM applications, and other
important data sources.
2. Scalability
Enterprise reporting environments
can grow quickly. Make sure the platform can support increasing data volumes,
users, and reporting requirements.
3. Data Security
Financial and customer information
must be protected. Evaluate access controls, authentication, encryption,
governance, and audit capabilities.
4. Customization
Different departments require
different dashboards. Look for flexible reporting layouts, filters, KPIs, and
visualization options.
5. Ease of Use
A powerful dashboard is less
valuable if employees cannot understand or use it effectively. Consider
training requirements and the experience of business users.
6. Performance
Evaluate dashboard loading times,
data refresh processes, query performance, and support for large datasets.
7. Total Cost of Ownership
Consider subscriptions,
implementation, infrastructure, integrations, training, and ongoing maintenance
rather than comparing subscription prices alone.
Best
Practices for Building Effective Enterprise Dashboards
Choosing the right software is only
one part of successful BI implementation. Companies should also establish clear
dashboard design standards.
Focus
on Important KPIs
Avoid placing too many metrics on a
single screen. Highlight the indicators that directly support the dashboard's
purpose.
Use
Consistent Data Definitions
Make sure departments use the same
definitions for important metrics such as revenue, customer acquisition cost,
and operating profit.
Design
for the Intended Audience
Executives generally need high-level
strategic indicators, while operational teams may require more detailed
performance information.
Keep
Visualizations Simple
Use appropriate charts and clear
labels. Avoid unnecessary visual elements that make reports difficult to
interpret.
Establish
Data Governance
Define who can access, modify, and
distribute sensitive information. Assign responsibility for data quality and
reporting standards.
Review
Dashboards Regularly
Business priorities change over
time. Review dashboard performance and remove outdated metrics that no longer
support decision-making.
How
AI Is Improving Enterprise BI Dashboards in 2026
Artificial intelligence is expanding
the capabilities of modern BI platforms.
Instead of relying only on
predefined dashboards, employees can increasingly use AI-assisted features to
explore business information and identify relevant insights.
Important developments include:
- Natural Language Queries: Users can ask questions about business metrics using
everyday language.
- Automated Insights:
AI can help highlight unusual changes and patterns in business data.
- Predictive Analytics:
Machine learning models can estimate potential future sales, demand, and
financial outcomes.
- AI-Generated Summaries: Some platforms can summarize analytical findings and
explain changes in selected metrics.
- Intelligent Data Exploration: AI-assisted features can help users investigate
relationships between different datasets.
These capabilities can make analytics
more accessible, but they do not eliminate the need for data validation and
human judgment. Enterprises should review AI-generated results before using
them for important financial or strategic decisions.
Final
Thoughts
Business intelligence dashboards
have become essential tools for enterprises that need reliable reporting and
effective data visualization.
Platforms such as Microsoft Power
BI, Tableau, Google Looker, Qlik Cloud Analytics, SAP Analytics Cloud, IBM
Cognos Analytics, Domo, and Sisense provide different capabilities for
organizations with varying analytical requirements.
Some focus on interactive
visualizations, while others emphasize centralized metrics, enterprise
reporting, planning, or embedded analytics.
The best solution depends on your
company's data infrastructure, reporting objectives, security requirements, and
budget.
By selecting the right BI dashboard
software and following effective reporting practices, enterprises can improve
data visibility, strengthen collaboration, and make more informed business
decisions.
Frequently
Asked Questions (FAQs)
1.
What is the best Business Intelligence dashboard software in 2026?
Popular options include Microsoft
Power BI, Tableau, Google Looker, Qlik Cloud Analytics, SAP Analytics Cloud,
IBM Cognos Analytics, Domo, and Sisense. The best choice depends on company
size, data infrastructure, and reporting needs.
2.
What is an enterprise BI dashboard?
An enterprise BI dashboard is a
centralized visual reporting interface that helps large organizations monitor
business performance, analyze KPIs, and share information across departments.
3.
What is the difference between a BI dashboard and a BI report?
A dashboard usually presents
selected metrics and visualizations in a summarized interface. A report
generally provides more detailed information, often with structured tables,
explanations, and supporting figures.
4.
Can BI dashboards display real-time data?
Some BI platforms support real-time
or near-real-time reporting, depending on the data source, connection method,
refresh configuration, and product capabilities.
5.
Which BI dashboard is best for data visualization?
Tableau is well known for its
visualization capabilities. Power BI, Qlik, Looker, and other platforms also
provide interactive charts and dashboards.
6.
Are enterprise BI dashboards suitable for small businesses?
Yes. Many BI platforms offer
solutions that can serve smaller organizations. However, businesses should
select a product that matches their actual reporting requirements rather than
paying for unnecessary enterprise features.
7.
How much does enterprise BI dashboard software cost?
Pricing varies based on licensing,
users, data volume, deployment model, and advanced features. Some platforms
offer public subscription plans, while enterprise deployments may require
customized quotes.
8.
How do AI features improve BI dashboards?
AI features can support natural
language queries, automated insights, anomaly detection, predictive analytics,
and report summaries. Their usefulness depends on data quality, configuration,
and human validation.


Comments
Post a Comment